

SYNCONICS BUSSINESS INTELLIGENCE DASHBOARD
Synconics Business Intelligence Dashboard - Free, Flexible & Powerful
We are excited to introduce you to our Synconics Dashboard App one of the most requested tools by Odoo users worldwide. Just as Odoo is a vital part of running a modern business, we believe a powerful dashboard is equally essential. After all, what good is great software if you can't see all your insights in one place? Most businesses struggle with scattered data - sales numbers in one tab, inventory data in another, and financial metrics hidden in reports.
Our Dashboard App solves this by bringing everything together into a single, intuitive, and real-time view. You can monitor KPIs, track progress, and make faster, smarter decisions - all from one screen. And because we know how important this visibility is, we are offering this app completely free.
With our Odoo BI Dashboard, you can create these functions and many more according to your business needs. Some key features include:
- ✅ Dashboard Builder - Create and manage multiple dashboards as per your business needs.
- ✅ Customizable Widgets - Add, arrange, and configure widgets to display KPIs you care about.
- ✅ Sales & CRM Insights - Build dashboards to monitor opportunities, revenue, and pipeline.
- ✅ Finance Widgets - Track invoices, payments, and cash flow in real time.
- ✅ Inventory Metrics - Stay on top of stock levels, product movements, and replenishment.
- ✅ HR & Attendance Views - Build dashboards for attendance, leaves, and workforce data.
- ✅ Unlimited Configurations - Each user/team can create dashboards tailored to their role.
 Community
-

 Odoo.sh
 Online
Who Can Use It?
👨💼 Managers & CEOs - Build executive dashboards for real-time performance monitoring.
📊 Sales Teams - Create sales pipelines and performance dashboards.
📦 Inventory & Supply Chain Teams - Customize dashboards for stock and logistics KPIs.
💰 Finance Teams - Get instant views of payments, invoices, and balance sheets.
👥 HR Teams - Track attendance, leave balances, and employee productivity.
Why Choose Our Dashboard?
⚡ Flexible & Configurable - Not a fixed dashboard, but a toolkit to create your own.
🚀 Easy to Use - No technical skills needed, build dashboards in minutes.
🎯 Business-Centric - Design dashboards around the KPIs that matter to you.
💡 Community First - 100% free, no hidden charges - forever.
Synconics BI Dashboard - Create Your Own Business Dashboards
Odoo BI Dashboard is a free and flexible tool that lets every Odoo user create their own dashboards. With customizable widgets, you can design personalized views for Sales, Finance, Inventory, HR, and more - all in one place. No pre-set limits, no extra cost - just the freedom to track the KPIs that matter most to your business.
Every Odoo user needs quick insights, but every business looks at data differently. That's why we built the Odoo BI Dashboard - a flexible and powerful tool that lets you design your own dashboards with the KPIs that matter most to you. Instead of switching between multiple reports, you can bring Sales, Finance, Inventory, HR, and other insights into one personalized view.
We are offering this app absolutely free of cost because we believe data-driven decision-making should be accessible to every Odoo user. This is our contribution to the Odoo community - giving businesses the freedom to build their own dashboards without extra cost.

Highlights of SYNCONICS BI DASHBOARD

Dashboard Menus

Auto Update

Dashboard automated send email

Multi company supported

Print PDF

Edit Layout

Drag Graph

Download graph - Excel, CSV, Image

Themes

Multi level graphs

Sorting

Filters

Record Limit

Multipliers

Share by Access Groups

Share by Users
Easy tracking of Activity logs

Easy To Use
Types Of Charts In BI Dashboard

Line Chart

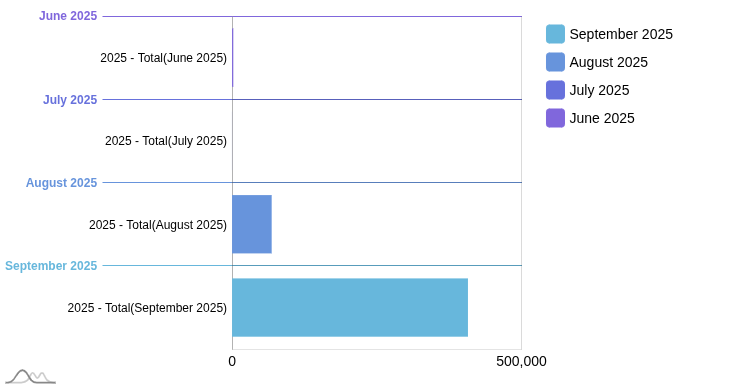
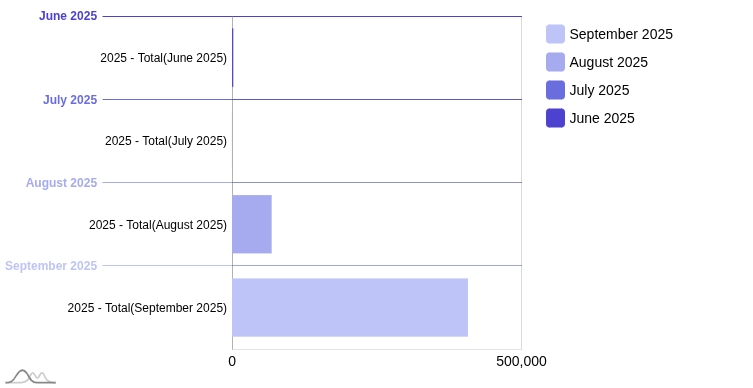
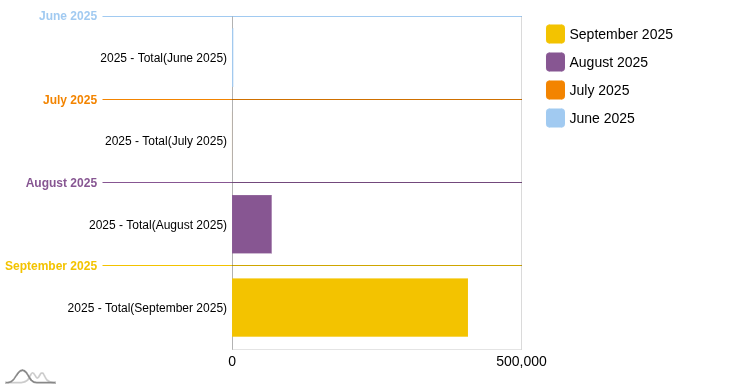
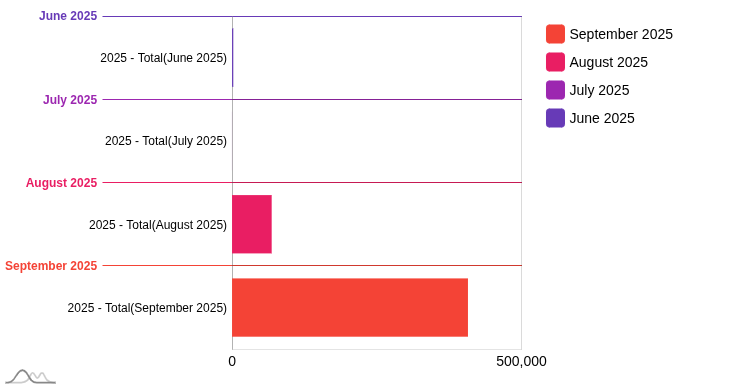
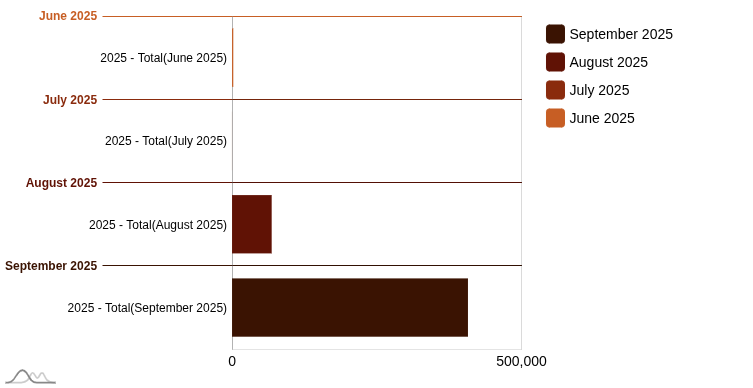
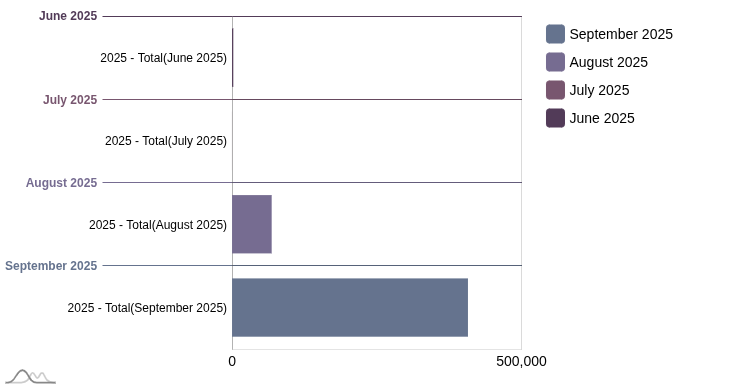
Horizontal Bar Chart

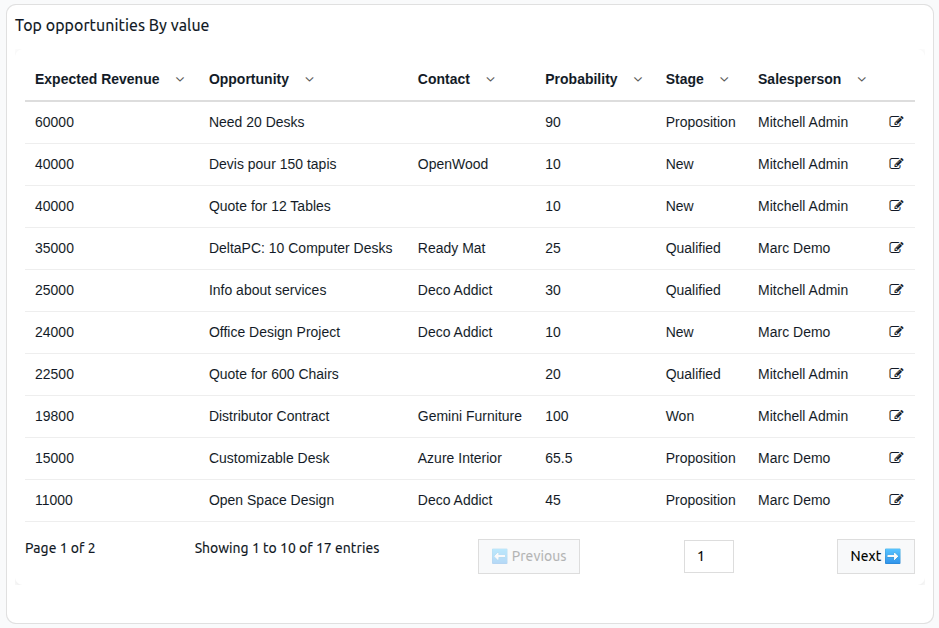
List View

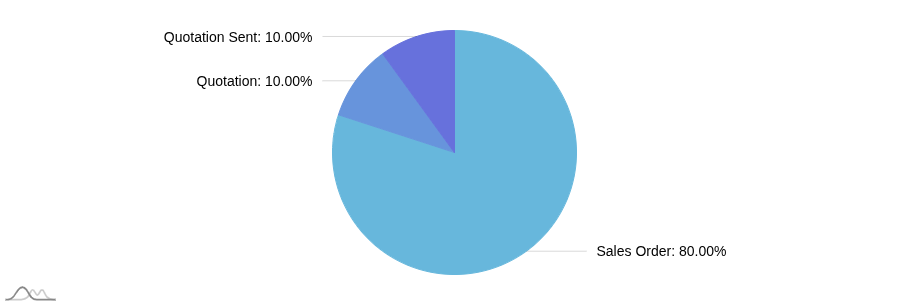
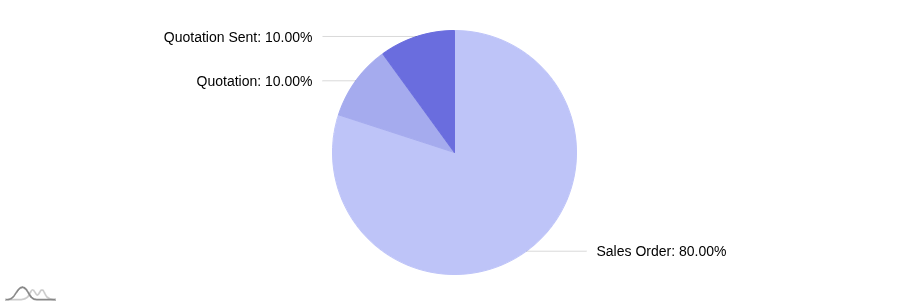
Pie Chart

Activity

Area Chart

Column Chart

Doughnut Chart

Funnel Chart

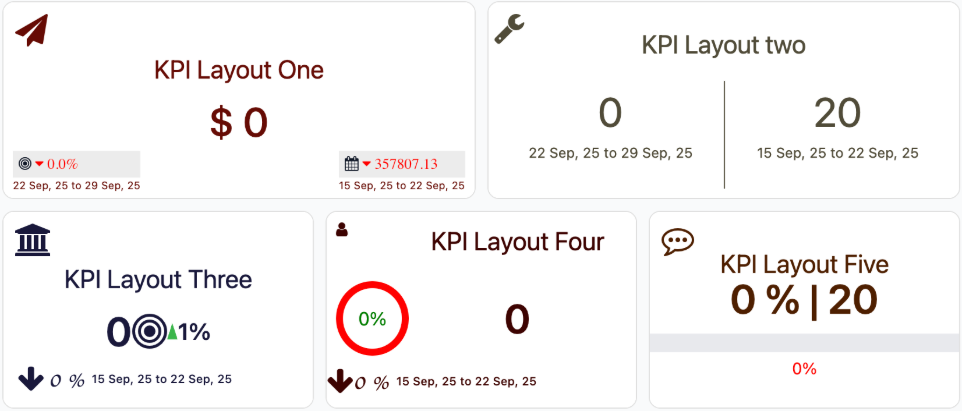
KPI View

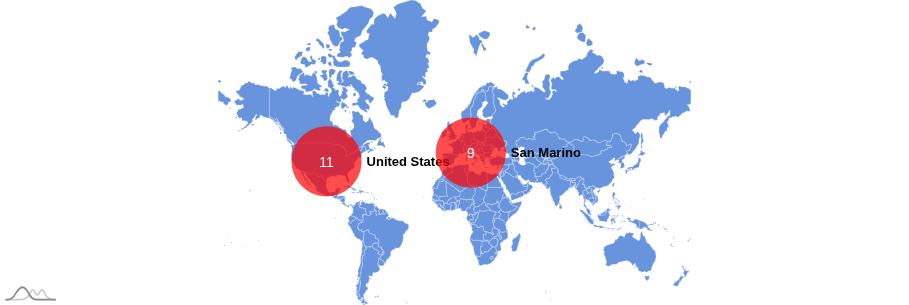
Map Chart

Radar Chart

Radial Chart

Scatter Chart

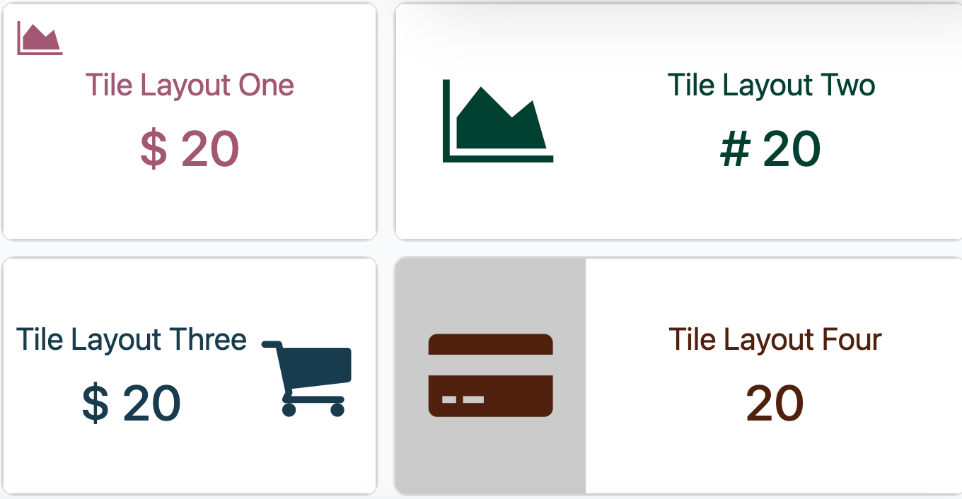
Tile View

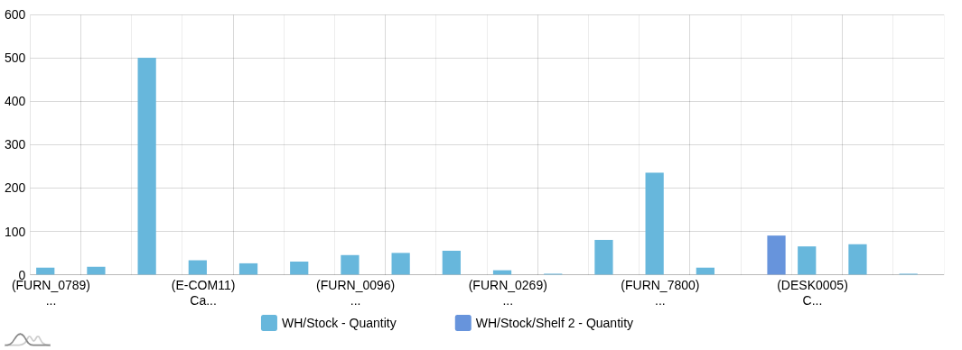
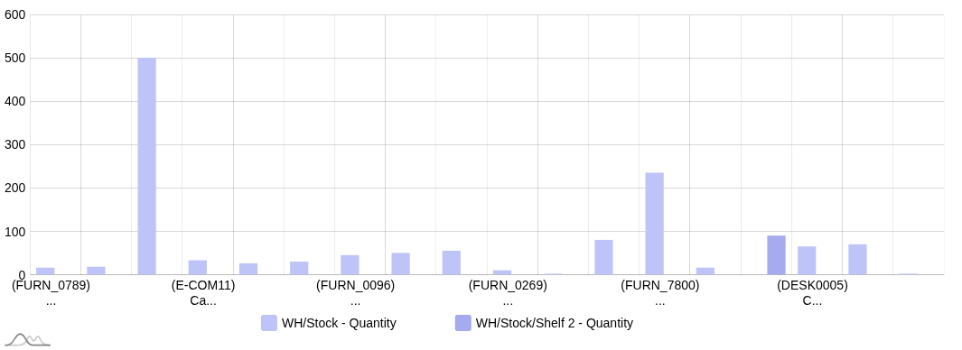
Stacked Column Chart

Meter Chart

Pyramid Chart

To Do
Key Features Of BI Dashboard
Supercharge Your Odoo with a Powerful, Customizable Dashboard!
Our Odoo Dashboard App gives you complete control over your data with drag-and-drop layouts, auto-refreshing KPIs, advanced filters, multi-company support, and one-click sharing. Visualize performance, share insights with your team, and make faster decisions - all from one intuitive, user-friendly interface.
| Dashboard Menus | A structured set of navigation options that lets users quickly access different sections or functionalities within the system. |
|---|---|
| Auto Update | Automatically refreshes dashboard data at predefined intervals, ensuring you always see the latest information without manual action. |
| Automated Email Scheduling | Send automated emails for KPIs, Tiles, To-Do items, and list views using pre-configured schedulers. |
| Share with Users | Easily share graphs with specific user groups or individual users - and revoke access when needed. |
| Multi-Company Support | Manage dashboards and data for multiple companies in a single system, perfect for centralized administration. |
| Print as PDF | Export your dashboard or reports as a PDF for offline sharing or easy printing. |
| Edit Layout | Fully customize your dashboard layout - rearrange or resize sections, widgets, and menus to fit your workflow. |
| Drag & Drop Graphs | Reposition visual elements with simple drag-and-drop actions for a personalized experience. |
| Download Graphs | Export graphs and charts in Excel, CSV, or image formats for further analysis or sharing. |
| Multiple Themes | Choose from five layout styles for KPIs and Tiles, customize background colors, fonts, icons, and alignments. Most graph types also support six unique visual themes. |
| Sorting Options | Organize dashboard data alphabetically, by date, or by numeric value - making it easy to find what you need. |
| Record Limit Control | Define the maximum number of records displayed at once (default: 20) to improve performance and keep dashboards uncluttered. |
| Advanced Filters | Apply single or multiple domain filters with OR/AND logic. Use powerful date filters for past, current, or future timeframes - daily, weekly, monthly, quarterly, or yearly. |
| Data Multipliers | Scale data values by applying multipliers for more meaningful comparisons or accurate reporting. |
| Share by Access Groups | Restrict visibility of dashboards to specific access groups, ensuring sensitive data stays protected. |
| Intuitive & Easy-to-Use | Designed for both beginners and experienced users with a clean, user-friendly interface. |
| Item Actions | Configure item actions so that clicking on a graph value automatically opens the corresponding detailed view. |
| Activity Log Tracking | Monitor all dashboard actions - including data changes, report generation, and user activities - for full transparency and auditability. |
More Information About BI Dashbord
Area Chart
Perfect for Forecasting in Sales, Inventory, or Production to display trends over time (e.g., demand growth).


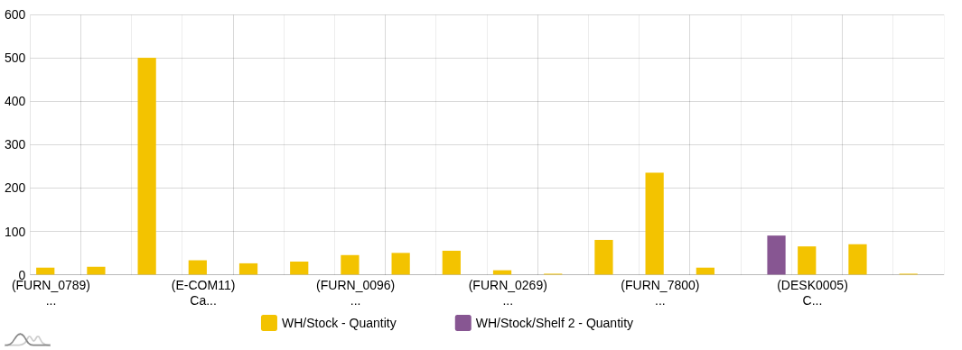
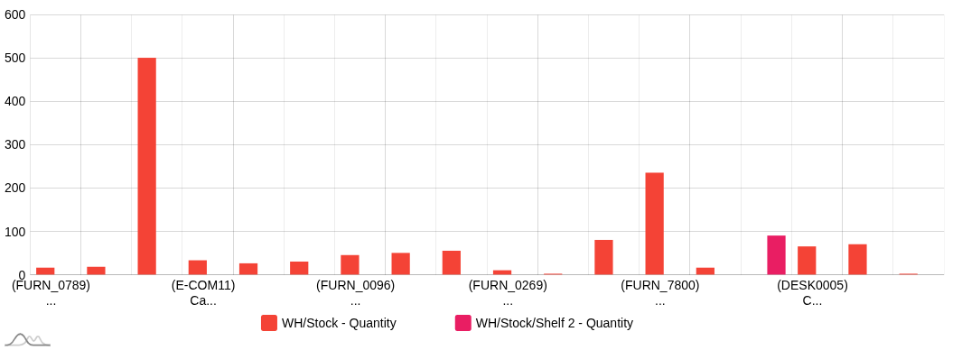
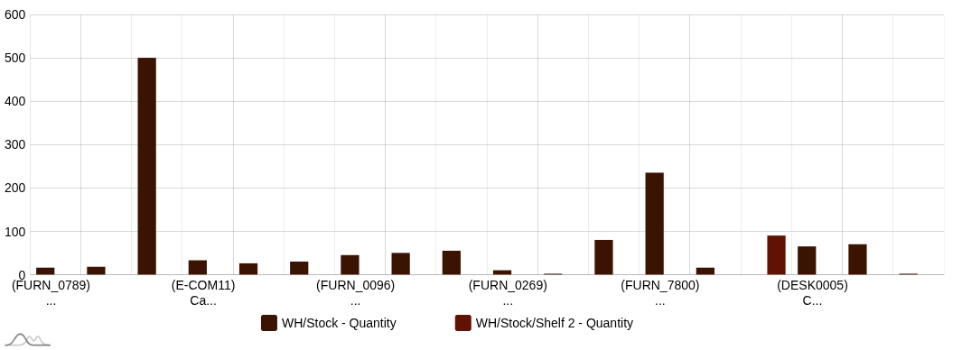
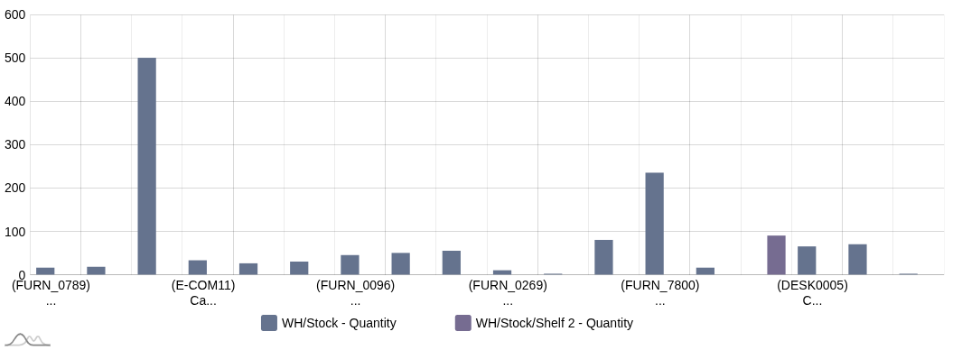
Bar Chart
Ideal for Sales & Purchase comparisons (e.g., monthly sales vs. purchases) or Inventory movement trends.
Column Chart
Best for Finance and Manufacturing to visualize costs, production volumes, or department-wise expenses.
Doughnut Chart
Works well in Sales & CRM for showing proportion of opportunities won/lost or in Accounting for expense category breakdown.


Funnel Chart
Designed for CRM to show lead-to-opportunity-to-quotation conversion stages.


KPI Views
Designed for CRM to show lead-to-opportunity-to-quotation conversion stages.
Line Chart
Excellent for Finance & Inventory to show time-based trends like cash flow, sales growth, or stock consumption.


Map Chart
Perfect for Sales & Logistics to visualize customer distribution, delivery routes, or regional performance.
Meter Chart
Excellent for KPI monitoring like production efficiency, budget utilization, or employee performance rating.

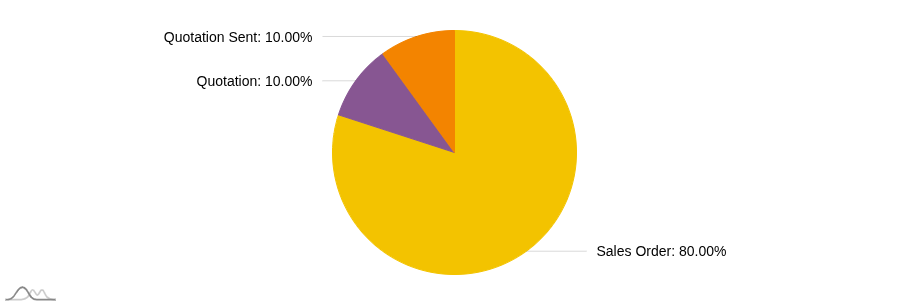
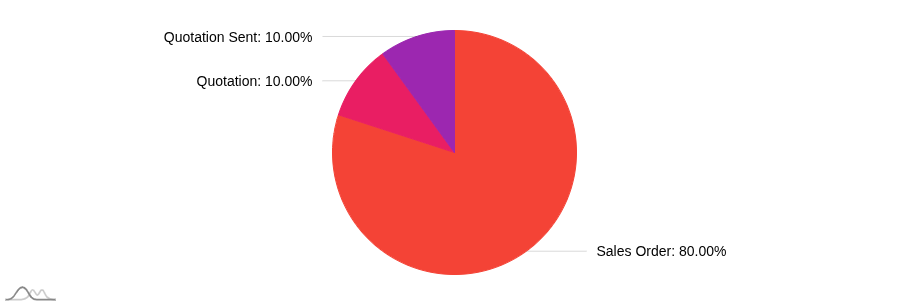
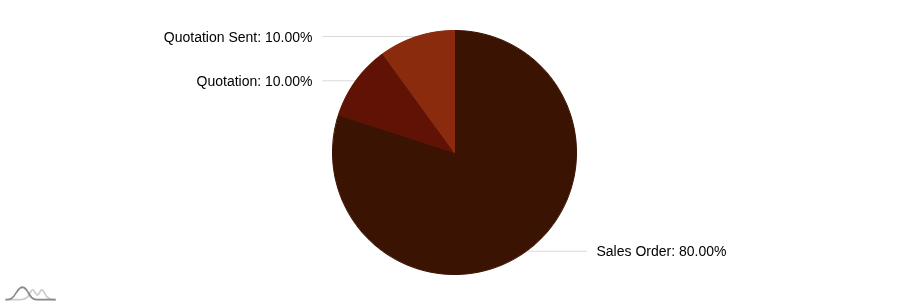
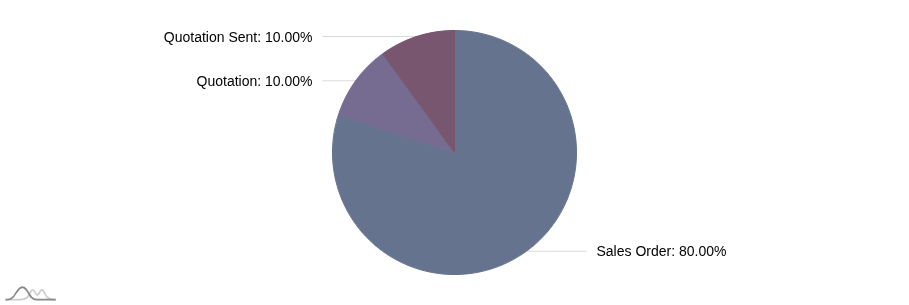
Pie Chart
Best for Expense Analysis in Accounting or Project Cost Allocation to show percentage contributions.
Pyramid Chart
Best for HR and CRM to display hierarchical data like employee structure or opportunity priorities.


Radar Chart
Useful in Performance Appraisal (HR) or Quality Control (Manufacturing) to compare multiple KPIs across dimensions.


Radial Chart
Works well for Target vs Actual reporting in Sales & Production modules.


Scatter Chart
Best for Quality Control & R&D to analyze relationships or distribution between two variables (e.g., defect rate vs. production batch size).


Stacked Column Chart
Ideal for Multi-Company or Multi-Product reporting in Sales/Finance, showing contribution breakdown within totals.


Tile View
Great for CRM, Project, and HR to show quick status summaries like leads in pipeline, open tasks, or employee counts
List View
Works across all ERP modules for detailed tabular data like invoices, orders, or inventory adjustments.
To Do Default
Best for Project, HR, or Support Teams to track tasks, approvals, and daily work status.

To Do Activity View

Service: Ask us for Dashboard creation for your business requirement
The app is completely free create as many dashboards as you need for Sales, Inventory, Accounting, CRM, and more. And if you prefer not to build it yourself, we also offer a paid service where our experts will create customized dashboards for your business, saving you time and giving you a professional setup from day one.
Note: The app integrates seamlessly with standard Odoo modules. For custom module support or advanced KPI integrations, contact our team for a tailored paid setup.
This Odoo BI Dashboard has been tested with Odoo standard modules and a vanilla Odoo system running on Ubuntu OS.
We strongly recommend:
- Installing it first on your testing or staging database.
- Validating and ensuring everything works as expected.
- Only then install it on your production environment.
Responsive Design
Coming Soon
Perfect mobile experience is on its way! Our responsive design will adapt beautifully to every screen size.
We promise! 🤝

Support the Project
Your contributions help us to improve this app, maintain compatibility with future Odoo versions, and add more features requested by the community.
Important Note for All Users
-
🎁 100% Free Contribution to the Odoo Community
- This powerful and high-demand dashboard app is offered completely free of cost.
- We are doing this to support and give back to the Odoo community.
-
🚫 Reviews & Feedback
- Please do not post negative comments or ratings for bugs or missing features.
- This app is free and built with significant effort, and we are committed to continuous improvement.
- For issues or suggestions, kindly open a support ticket instead of commenting in the review section. This allows us to resolve them faster and more effectively.
-
🛠 Help Us Improve - Open a Support Ticket InsteadIf you discover bugs or have enhancement ideas:
- Submit a support ticket with details.
- This helps us track, prioritize, and fix issues systematically.
-
🤝 Let's Build Together
- We welcome constructive feedback and collaboration.
- Together, we can create powerful, free, and reliable Odoo apps for the global community.
-
📌 Usage Terms & Proprietary Notice✅ Free to Use - ✖ Not Free to Resell or Rebrand
-
You cannot:
- Rebrand, rename, or relabel this app as your own.
- Sell, license, or redistribute it (even with minor modifications).
- Redistribute or publish it on any marketplace under your or another name.
- Offer it as a paid product or service without prior written permission.
-
🔒 Future Odoo Versions:
- All rights to this Dashboard App are reserved. Unauthorized migration, republishing, reselling, or listing on any marketplace under another name is strictly prohibited.
-
You cannot:
-
⚖️ Not for Commercial Redistribution
- You may use this app for personal or client projects.
- But you cannot offer it as a paid product or service without prior written permission.
-
🙏 Respect Our Effort - Keep It Ethical
- We've invested significant time, money, and development effort to create and share this app.
- Please respect the open spirit behind this contribution.
-
⚠️ Violations May Lead to Legal Action
- Any unauthorized reselling, redistribution, or modification for commercial gain - including newer Odoo versions - may result in legal enforcement under copyright & IP laws.
- We reserve full rights to this app and all future updates.
- Collaboration and ethical use are always welcome - misuse is not.
-
⚠️ Legal Disclaimer
Any misuse, unauthorized resale, or redistribution for commercial gain may result in legal enforcement under copyright and IP laws. We reserve all rights to this app, including future updates.
Changelog
Stay up to date with the latest features and improvements
While sending an email, will the graphs display the defined icons?
Yes, your custom-defined icons will be displayed. Odoo's FA-icons will not be shown.
When a graph is sent via email, I can't see the graph in the email body. Why?
For that, SSL configuration is required for the domain you are using.
In the Activity Graph, I want to see the most recent activity first, followed by older ones.
To do that, you need to select the Descending option in the configuration of the Activity Graph.
What is the Auto Refresh Interval in the dashboard configuration?
It defines the time interval after which your dashboard will automatically refresh to reflect the latest updates made to the records used in the graphs.
What is the Automated Email configuration in the dashboard?
By configuring graphs with this feature, emails for those graphs will be automatically sent to recipients when the cron job runs.
How can I hide 'False' values in a graph?
While configuring the graph, there is an option to hide 'False' values. You can enable that option.
Can I define multiple domains in graph configuration?
Yes, you can define multiple domains. However, make sure they are logically valid; otherwise, the results may not be accurate.
What does the 'Item Actions' tab do in graph configuration?
Based on the criteria you define, this allows you to navigate from one graph to another. For example, clicking on Graph 1 can display Graph.
I can't see the 'Multiplier' option in the graph configuration?
The 'Multiplier' option will be enabled only when the Data Type is set to Sum or Average in the Data tab of the graph configuration.


 Our Apps
 Our Themes
Odoo Expert Services


connect on whatsapp.